X
These tiers represent different parts of the country based on current vaccination rates.
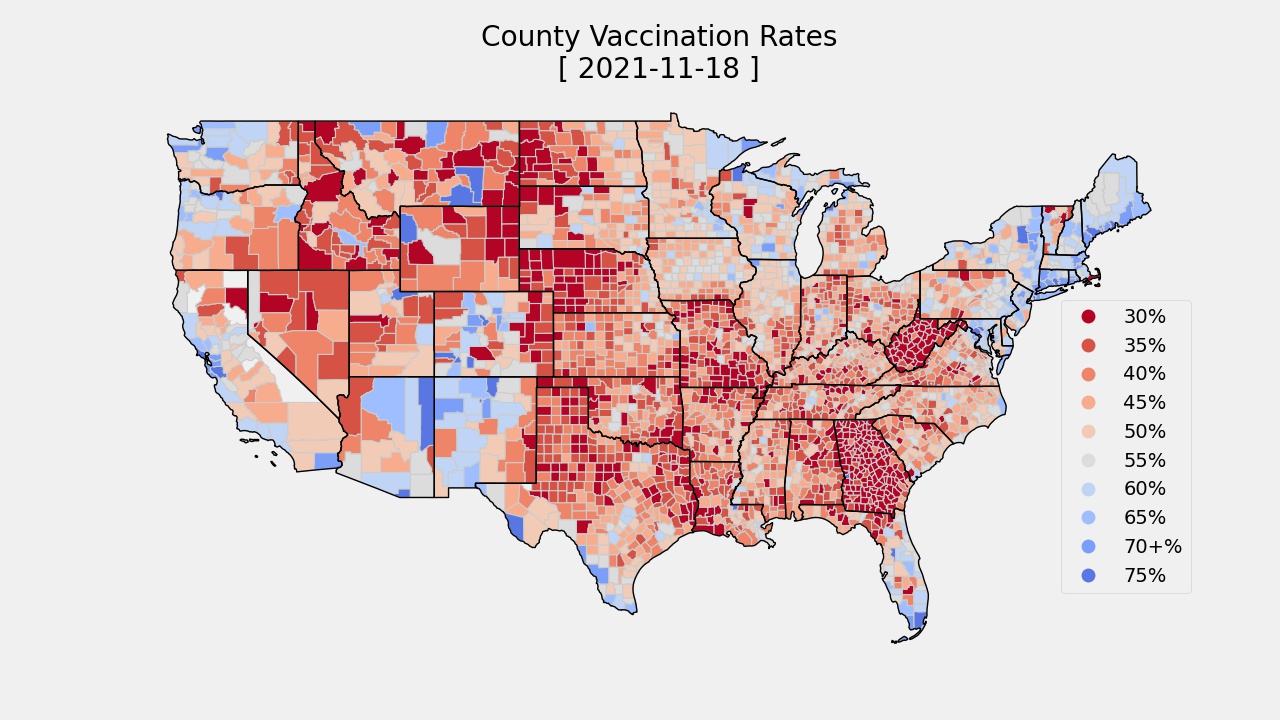
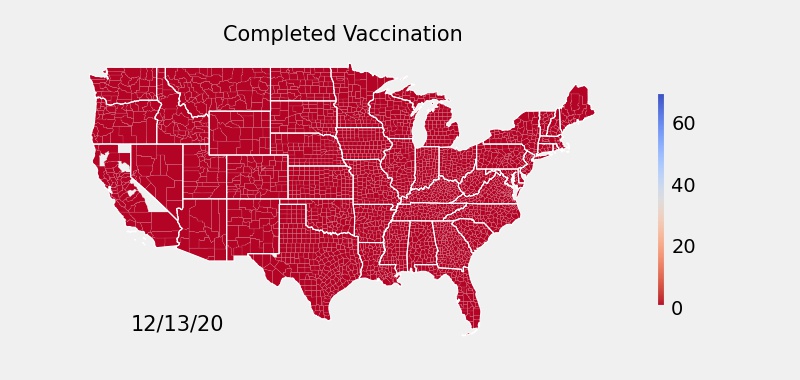
This is the current state of vaccination in the United States. If each county was grouped together by vaccination rates. How would these counties fare throughout the pandemic?
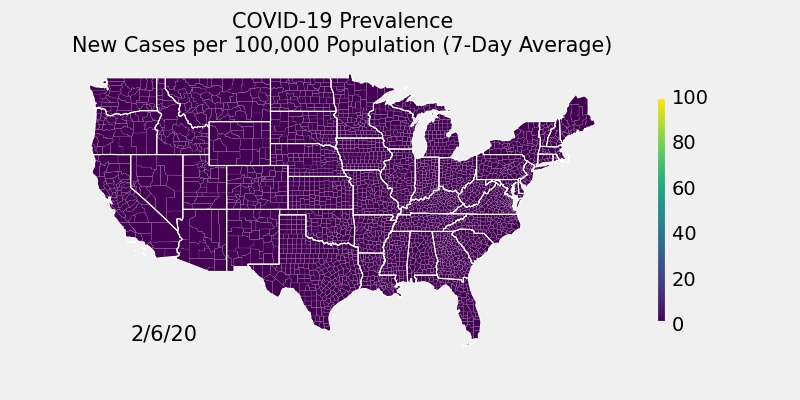
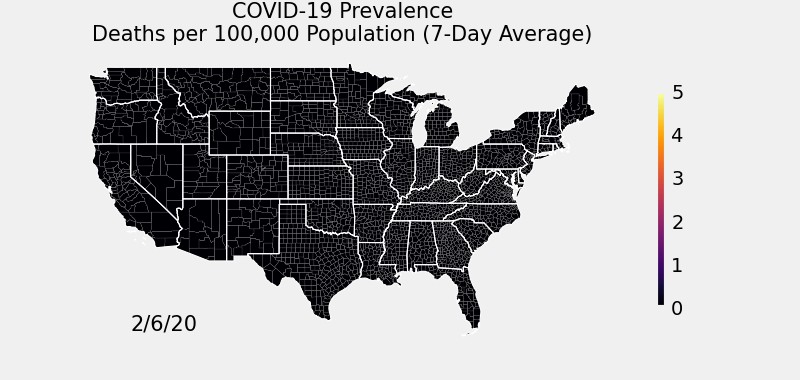
Move the slider to see how COVID affected these counties throughout the pandemic. Vaccines weren't deployed till the start of 2021 and didn't see significant vaccination levels till March 2021. Until then, COVID affected all counties similarly. After the COVID surge of July 2021, the affects of vaccines can be seen especially in death rates.
Move the Slider to See daily COVID data throughout the pandemic.
These tiers represent different parts of the country based on current vaccination rates.